Factor benchmark crowding: the hidden costs


Imagine you would like to de-risk your asset mix a little. Equity markets are enjoying a ten year bull market run and are still almost at all-time highs, valuations seem stretched and several macro- and geopolitical risks lie ahead. You do not want to make drastic shifts in your asset mix, nor engage in a complex derivatives strategy.
Transitioning part of your passive or active equity funds into a low risk strategy is a more suitable solution. The problem you might face is that you do not have the team and IT infrastructure to run such strategy yourself.
Lucky for you, benchmark providers are here to help you out. Whereas they originally only focused on market cap weighted indices, a small ten years ago they developed various factor benchmarks. The research, development, portfolio construction and risk control through restrictions on individual security, sector and country weights is taken care of.
From the benchmark provider you receive the end product: a benchmark you can replicate as it was a passive market cap one. Measured by the number of assets tracking, MSCI’s Minimum Volatility index is the most popular factor benchmark.
Part of the popularity came from the launch of the iShares ETF on this benchmark in 2011. Investors eagerly jumped on this opportunity to easily gain access to a low risk strategy which spurred the AuM in this ETF to 32bn USD in 2016. This surely means that this low risk strategy must be good, right?
Well…no, just as popularity is one of the attributes you should not be looking for in a public benchmark.
The motivation for starting my research (see link below) into market impact in MSCI’s Minimum Volatility index was one peculiar trade. This trade was part of MSCI’s semi-annual rebalance of its Minimum Volatility index on May 29th 2015.
US chemical producer Sigma- Aldrich was added to MSCI’s index at the close of that day. The company had already received a full cash takeover offer of 140.00 USD a share by its German competitor Merck eight months before. In the weeks prior to MSCI’s rebalance Sigma-Aldrich had been trading in a tight range around 139.00 USD a share as the deal still took a half year to close.
Just minutes before the market close on May 29th, Sigma-Aldrich’s stock price quickly rose from 139.00 to and above 140.00 due to MSCI investors which were very anxious to get hold of the stock and even more so to not miss their benchmark entry point. The stock ended up trading up a high of 140.03 USD a share, indicating that some investors settled for a sure loss as they will never receive more than the takeover bid of 140.00.


The example above illustrates a very negative consequence of popularity: if we all want to buy the same stock at the very same time, we are all going to pay a high price and thus face the same low future return. Aside from the fact we all should question MSCI to add such a stock in a low risk strategy in the first place, we should not have been all that surprised to see something happen like this.
It is one thing if you preannounce a trade you are going to make to a few friends, it is another when you tell the entire world. Rebalance trades in the Minimum Volatility index are sent by MSCI to all users and non-users of the index nine days ahead of the implementation day. By doing so, not only a crowded index is causing excess market impact, MSCI is giving everybody not invested in the index an opportunity to yield some easy arbitrage profits.
This is exactly what we have seen happening. Stocks that increase in weight return an average of +1.58% between announcement and effective day. Stocks that are (partly) sold during the index rebalance return an average of -0.63% in same time period. This results in an index spread (difference between buy and sell basket) of +2.21%, making the rebalance 2.21% more expensive on effective day than on announcement day. As the index uses 20% turnover annually, for investors in this index this accumulates to a performance drag of 0.44% annually due to excess market impact.
Investors using this index are advised to take action, either by rebalancing their portfolio out of sync with the standard rebalance schedule of MSCI or by switching to a similar low risk index with fewer assets tracking.
A better alternative may be to develop an own strategy. Not only are you the one determining the definition of the factors, the portfolio construction and risk limits, you only have to deal with your own market impact. MSCI on the other hand is encouraged to lower the market impact in this and potentially similar indices by creating additional versions with different rebalance schedules.
Alternatively, MSCI could rebalance more often in their main index and thereby generating smaller trades, thus lowering market impact in each rebalance and in the overall index.
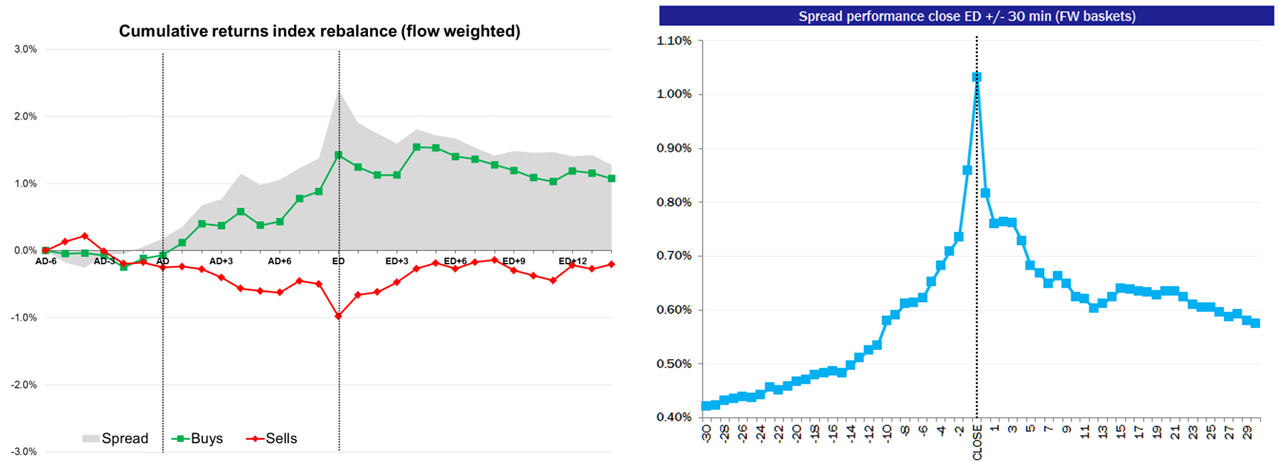

Left: Average cumulative abnormal return of 12 rebalances between 2011 and 2016. Dotted lines represent resp. announcement day (AD) and effective day (ED). Spread peaks at the close of ED at +2.41% vs AD-6. Source: PGGM Systematic Equity Strategies
Right: Intraday spread performance 30 minutes before and after close. Source: PGGM Systematic Equity Strategies
René’s thesis awarded with the CFA Society VBA scriptieprijs 2018 can be accessed here.
Share or Print Article
click on the icon